Platforms and Passageways Maps Community Resources in Colombia
The focus of the BorderWork(s) research project Platforms and Passageways is on how to coordinate the information that internally displaced Colombians need as they return to their home villages. One of the tools they have developed is a set of color-coded maps showing the status of various community resources. Below are two such maps, which illustrate two distinct measures of the extent and quality of the water supply across the different villages of the municipality of San Carlos.
The first map represents the coverage of aqueducts and wells. If the village is in green, village presidents reported that 100% of homes have access to water. If the village is in yellow, 60-99% of the homes have access to water. If the village is in red, less than 60% of the homes have water. Village presidents provided this information to municipal government officials in March 2013.
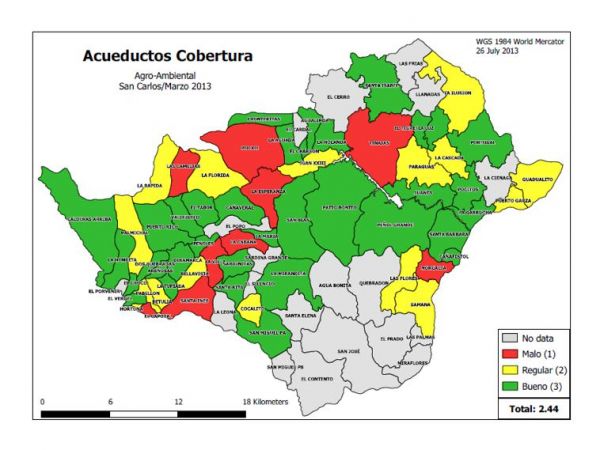
A score for the overall quality of water access through the municipality is calculated by assigning a value of 3 to green, 2 to yellow, and 1 to red. The overall score, shown on the lower right of the map, is the average of those values over all reporting villages. There is no information for nineteen villages. Five of these are unpopulated; the other fourteen did not respond. The overall scores are meant as a tool for municipal planning. They establish a baseline for the quality of a particular resource, which helps in setting goals and tracking progress.
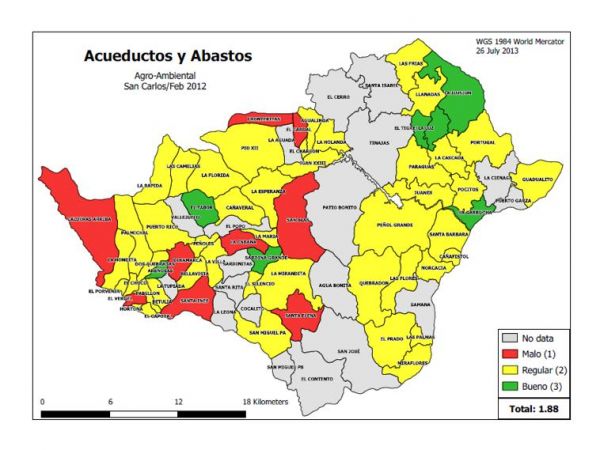
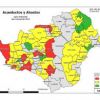
The second map shows the quality of village aqueducts and wells. Unlike the previous map, this is a shared resource rather than a household one. Also, the indicators are far more qualitative. They represent the community’s perception of their aqueducts and wells, either that they are good (green), that they need improvement (yellow), or that they are poorly functioning, broken, or non-existent (red). This information was gathered in February 2012 as part of village development plans.
The two maps represent both the possibilities and problems with this methodology and tool. Both maps are meant to be tools for external funding agents and municipal officials to prioritize assistance and target planning. They can also be used for planning at the village level and as a monitoring and evaluation tool to illustrate change over time to external funders and community members.
The process of collecting information and creating indictors are the two biggest problems facing such a project. Village presidents provide information to municipal officials regarding the status of their communities. But not all villages have active presidents or community councils, and these villages are often most in need of assistance. Additionally, while the first map reflects clearly defined, quantitative indictors, the second reflects qualitative perceptions—what one village perceives as a high quality aqueduct might be seen as needing improvement in another village.
Despite the difficulties, these maps and the community process of data collection provide some of the most detailed and collaboratively obtained village-level information in the region. Platforms and Passageways student Saira Butt made these maps and seventy others in class and during the summer in San Carlos. Some of her reflections on her time in Colombia are included in an earlier post.
Referenced People
 Graduate Student, Cultural Anthropology
|